Author Archives: Vladimir

How to Track Custom Variables in Web Statistics

Recently I found few interesting questions about how to track custom variables with Google Analytics. The question well makes sense, even if your website is not a complex web application that your visitors log in to. “Simple” showroom websites could benefit from such kind information too, providing that you want to learn more about visitor behavior grouped by data not already included in stats. Here’s an example of how you can do this with Web Log Storming, but you might apply similar steps if you use some of other tools too.

Let’s say that you run online shoe-shop. At some point, you decide to present a simple survey to your visitors and put results into cookie information. In this case, you would probably be interested in demographic information such is gender, age, marital status, etc.

Disclaimer: I’m completely ignorant about selling shoes (Al Bundy would probably know better), so don’t mind if I completely missed what matters in this business. πŸ™‚

Setting up a website

Step 1. Building a survey

Real shoe storeFirst thing you need to do is to actually build a survey. How to do that is beyond scope of this article, so I’ll leave it to you. But all surveys have something in common: they contain questions. Let’s say that questions for this example are:

  1. Gender (Male / Female)
  2. Age (20-ies / 30-ies / 40-ies / 50-ies / 60-ies…)
  3. Marital status (Single / In relationship / Married / …)

You get the picture. Put answers into a cookie and you’re ready for the next step.

Step 2. Logging this information

If these individual answers stay in visitor’s local cookies, you won’t be able to use them. It’s actually easy to “trick” a web server to write them down for you, and here’s how.

First, create a transparent 1×1 pixel gif image and upload it to your server (for example: myvars.gif). For your convenience, you can get one from here (right-click on link and save image).

Now change your web pages (or just one of them, depending how your website is organized) to include code into header or footer, similar to this:

<img src="/path-to/myvars.gif?g=<?php $_COOKIE['gender']; ?>" />
<img src="/path-to/myvars.gif?a=<?php $_COOKIE['age']; ?>" />
<img src="/path-to/myvars.gif?s=<?php $_COOKIE['status']; ?>" />

You would probably want to replace $_COOKIE[ ] parts with your functions, but we’ll keep it as simple as possible here.

These images will be invisible to visitors, but your log files will from now on contain lines like these:

1.2.3.4 [18/Oct/2009:22:20:06 -0600] "GET /myvars.gif?g=female HTTP/1.1" 200 ...
1.2.3.4 [18/Oct/2009:22:20:06 -0600] "GET /myvars.gif?a=40 HTTP/1.1" 200 ...
1.2.3.4 [18/Oct/2009:22:20:06 -0600] "GET /myvars.gif?s=married HTTP/1.1" 200 ...

Note the emphasized parts behind question marks. Instead of placing an image for each variable separately, you can combine them into one request, so your get ?g=female&a=40&s=married. It’s up to you how you want to track them later.

Now we only need to extract these into a meaningful statistics.

Extracting and analyzing custom variables

As I said before, it might be possible to analyze this info with other products (although often with limited possibilities), but here we’ll show how you can do that with Web Log Storming. For purely selfish reasons, of course. πŸ™‚

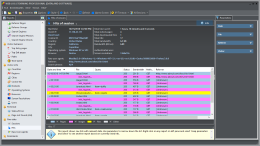
Custom variables in Web Log StormingFirst, you can use Queries report to see how popular each survey option is. If you define your Goals in this report you’ll also be able to see how well each of visitor groups convert.

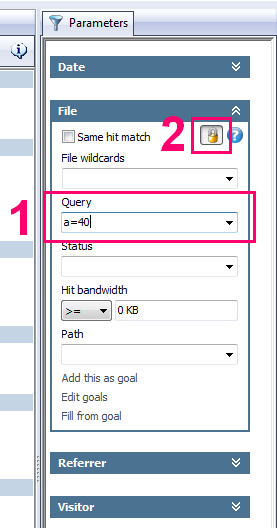
Next and even more important, you can set up a Query parameter to focus on specific groups and analyze them separately. With Web Log Storming it’s really easy to do that (see the screenshot):

  1. Type a filter into Query parameter (for example: “a=40”) and hit Enter. Whatever report you have active at this moment, it will now be based on visitors in forties only.
  2. Optionally, click Lock button to base all other reports you select on the same set of visitors, until you explicitly remove this filter.

It’s simple as that, but there’s more possibilities for advanced filtering by combining more than one group, comma separated. Here are few examples as an illustration:

  • s=married, s=relationship
    All visitors either married or in a relationship
  • s=married, s=relationship, +g=male
    All male visitors either married or in a relationship (note the “+” sign)
  • g=female, -s=divorced
    All female visitors who are not divorced (again, note the “-“ sign)
  • +a=30, +s=divorced
    All divorced visitors in their thirties

There are numerous combinations and possibilities, and for more info how wildcards work in Web Log Storming, check this page in the user manual.

Note: if you decided to combine all variables into one request (ie. ?g=female&a=40&s=married), you’ll need to enclose filters in wildcard (asterisk) character, like this: *a=40*, +*g=male*.

How to use these insights or “Why should I care”?

Common sense tells us that our website should “push” male shoes to males and female shoes to females, right? But is it possible that it’s not the best choice? What if your analysis show that married middle-aged males often buy shoes to their spouses as a gift? You would definitely want to make it easier for them to do so.

Or maybe you discover that divorced people, regardless of age, are more likely to buy more expensive shoes, so shouldn’t you present them an appropriate offers? Or maybe this doesn’t apply to divorced people in their sixties? Maybe people in sixties are generally not interested in expensive shoes, regardless of marital status?

There is lot of questions which all make sense to me, but I’ll just stop – if someone told me month ago that I will spend this much time thinking about shoe market… πŸ˜‰ Besides, I’m sure you understood the importance of visitor segmenting buy now and that you know what questions relate to you business.

Links

Web Log Storming website
Web Log Storming 30-day trial download
The Remedy for a Web Analytics Headache

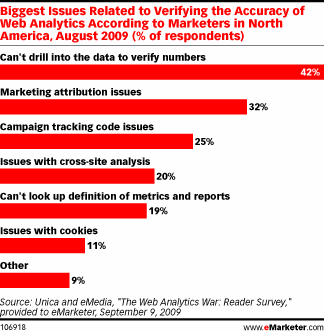
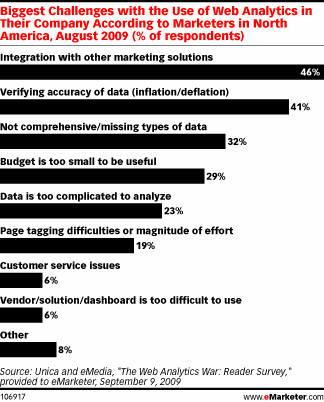
According to “The Web Analytics War Reader Survey” by Unica, as published on eMarketer website (The Web Analytics Headache), lot of marketers have problems with their current web analytics solutions. This is a breakdown of the results:

Biggest challenges of web analytics Biggest issues related to Verifying Accuracy

Could our Web Log Storming be the remedy for at least part of those? Let’s see…

1. Verify accuracy of data (41%)

This is a major issue, and, to be honest, we are glad so many people are aware of it. πŸ™‚ Second graph above shows specific reasons.

a) Can’t drill into the data to verify numbers (42%)

Web Log Storming is all about drilling into details. It allows you to to actually see list of sessions/visitors (filtered by any metrics) and all available details of each one of them (visitor data and individual hits). This allows you to react and easily exclude those you don’t wish to affect your statistics (for example, spiders, yourself, your employees, etc).

b) Marketing attribution issues (32%) and Campaign tracking code issues (25%)

These are actually related to other accuracy problems (due to JavaScript and code problems, hits that JavaScript analyzers are unable to track, etc). As web servers log every single request, the risk of losing data is minimal. In fact, most argue that log analyzers are useless because of this, as people are generally not interested in spiders and similar “dummy” traffic. I partially agree: other analyzersΒ  might be useless, but Web Log Storming’s ability to drill-down and easily filter out those is of utmost importance.

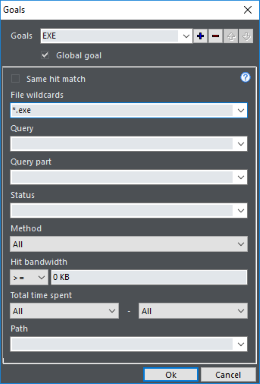
Back to the topic: with Web Log Storming you can define goals any way you like, as opposed to GA which allows you to assign a goals to pages only. Goal can be a page, sequence of pages, query, an image accessed from a third-party website (useful if you confide payments to specialized services), bandwidth usage, etc.

After setting a goal, every report shows conversion totals and percentages for each presented item (referrers, periods, pages, user agents, …) .

c) Issues with cross-site analysis (20%)

One solution for cross-site analysis is already mentioned in previous point: embed an image from your web server in a third-party web page (it can be white 1×1 pixel gif, invisible to visitors) and all hits to that page will be noted in your stats.

However, if you actually own and run several related websites, it would be nice if you could analyze them together. It’s not a problem for Web Log Storming. You should already have access to server logs, and all you need to do is to include them into the WLS project. It’s not even necessary for those websites to be on the same server – you can combine stats from IIS and Apache servers into joined reports. To easily distinguish hits from different websites, just use a Prefix option (/website1/index.html, /website2/index.html).

d) Can’t look up definitions of metrics and reports (19%)

In Web Log Storming, we tried to use as little technical terms as possible, and they are explained in a user manual page. By default, each report is described with one or two sentences at the bottom of the window, and user manual contains more detailed descriptions. Maybe it’s not enough, but we would like to hear any ideas for further improvements.

e) Issues with cookies (11%)

Web Log Storming doesn’t use cookies. But wait, don’t reach for a comment form yet: cookies do have their advantages over IP-based unique visitor detection, but vice-versa is true too. Which one gives better results? It probably depends on a website and profile of visitors. Here are few considerations to think about: more and more visitors use a broadband connection (with relatively static IPs), more and more visitors set up browsers to delete cookies, number of visitor that bring a laptop to another network is probably still outnumbered by visitors who use different computers on a different networks, etc.

You should really decide for yourself on this one… Point a) above (drilling down) should help you with it.

2. Not comprehensive/missing types of data (32%)

Some data is not possible to track with Web Log Storming, and it’s mainly related to client-side specifics, such is screen resolution, window size, JavaScript support, etc. This is purely because of technical limitation of server log files (this info doesn’t exist). If you really need them, you can always install some free JavaScript code. For everything else, there’s Web Log Storming. πŸ™‚

3. Budget is too small to be useful (29%)

I must admit that I’m not sure if I understood this one. I suppose that it’s related to the fact that free stuff is rarely good enough and other solutions are too expensive to consider? Well, Web Log Storming is really not that expensive (some say it’s too affordable for the value it provides). There’s no recurring fees and, once you buy a license, you can use it freely forever. You get free upgrades for certain time and, after that period, you can stay with version you own without paying a single cent, unless you decide that improvements are worth the upgrade price (which is discounted, of course).

4. Page tagging difficulties or magnitude of effort (19%)

There’s no page tagging in Web Log Storming as it uses server log files, which almost all hosting companies provide (if it doesn’t, consider switching – seriously, as chances are that this is not the only problem you have with them). This is important, not just because for most people it’s easier to download log file than to edit pages or templates. Other benefits of not-tagging are:

  • Log files (and thus statistics) exist even before you include tags.
  • If you switch from one tag-based solution to another, you can kiss goodbye old data. If you switch from any kind of solution to a log-based solution, you still get all stats from the past. You’re not locked-in in any way.
  • Code errors: omit a single but vital character and stats won’t work.
  • Put a script code at the end of the page (as GA people suggests), and you risk that visitor will click away before page is fully loaded, resulting in lost hits.
  • Put a script code at the beginning of the page and your website will become sluggish. Actually, total load time would be the same, but there’s more chance that visitors won’t notice it if code is at the end.
  • Did you know that some people love to block Google Analytics and other similar tags?

5. Customer service issues (6%)

We are small company. Small companies, by definition, try harder. Every single customer and potential customer matters to us and we will commit any reasonable effort to make our software work for you in a way you want. We listen and welcome any new ideas and pursue any problem that you might have. Emails are responded by developers, not some independent (incompetent?) customer support service.

Yes, that’s a promise.

6. Vendor/solution/dashboard is too difficult to use (6%)

Not everyone can set up a separate job place for an analytics specialist (and, according to the survey, 72% of contenders don’t). Initially, we made Web Log Storming for ourselves, and made it reasonably understandable and easy to use for people who’s job title doesn’t contain “analytics” word. Part of this benefit lies in its interactivity, allowing you not to dedicate your life to predict what information you will need in the future. When you get a new idea, just dig outΒ  that information from existing log files. That makes Web Log Storming a perfect solution for small businesses – get the right information at the moment you need it.

Conclusion

If I would want to play silly, I would say that it’s now proved that Web Log Storming is 159.09% better than any other web analytics solution. πŸ˜‰ But seriously, everyone should ponder all available options and choose what works best for them.

Web Log Storming is a server log file analyzer, and, according to some previous blog comments and feedback, that appears to be a deal-killer for some people. It’s understandable. Google’s marketing machinery is slightly stronger than ours, and nobody gets fired by recommending IBM, Microsoft or Google. πŸ™‚ Sure, JavaScript solutions have own advantages, but please, hold back from putting Web Log Storming in a same basket with other log analyzers, at least not for now. If you wish to disagree with this post, it would be reasonable if you download and install free 30-days trial first, before forming and sending an opinion. Any critics directly related to our product are welcomed. Thank you for understanding! πŸ™‚

Links

Web Log Storming web site
Download Web Log Storming free 30-days trial

Similar articles

Which web log analyzer should I use?
10 strengths of web log analyzers compared to JavaScript based analytics
Busting the Google Analytics Mythbuster

Web Log Storming v2.2 is available for download

Web Log Storming v2.2 is now available for download. Changes in this release include several small new features, improvements and bug fixes.

New option for file reports: Add to Global Filters

Add files to global filtersNow you can more easily add unnecessary files to global filters (see “Improving performance” suggestions). To use it, view any of file reports (pages, files, images, directories, etc), see which files take lot of hits that doesn’t affect your stats (style sheets, logo images, etc), right click on them and choose “Add to Global Filters” option. Next time you read log files these will be excluded from reports.

New option: Manually Edit Host Name

This one is available in Sessions, Domains and Session Details report. You can now change visitor’s domain name to any text you like, so instead of having something like qwerty123456.domain.com, you can describe visitors as My home network or Important customer.

Introducing two editions: Standard and Professional

If you don’t need some of options, you can now buy less expensive Standard edition of Web Log Storming. Currently, Standard edition costs $119 (US) while Professional remains at the same price point ($189). Removed features include goals, host resolving, exchange options (export, print, send by e-mail, …), some reports, etc. For full list of differences please refer to this page.

Upon start, users who are evaluating trial version can choose which edition they want to try out. Existing customers won’t notice any change from this as all of you already have Professional version.

Other changes

Other less importantΒ  improvements and bug fixes.

Links:
Web Log Storming home page
Download an update
Compare editions

Web Log Storming: up to 40% competitive discount

In addition to an educational 30% discount, we have just announced a competitive discount of 20% or 40% (depending on product). We believe that this could be a nice opportunity to either switch to Web Log Storming or to use it as an additional analytics tool. You just need to send us a screen shot with a proof – it could be a picture of the About box with your name in it (if it’s a desktop solution) or a picture of a web page for a hosted solution.

For paid packages (either desktop or hosted) the discount is 40%, which means that you can get new Web Log Storming license for only $113.40 (US).

And this could surprise you. The discount is currently available even if you use free analytics package, but with an additional condition: you must use it for at least two months (make sure you set date range accordingly when taking a screen shot). In this case discount is 20% and your price would be $151.20 (US).

The offer is also available for the upgrade from old version of Web Log Storming ($47.40 / $63.20).

Visit Web Log Storming website for more information

10 reasons why web log analyzers are better than JavaScript based analytics

In this article we are going to point out some objective strengths of web server log analysis compared to JavaScript based statistics, such is Google Analytics. Depending on your preferences and type of the website, you might find some or all of these arguments applicable or not. In any case, everyone should be at least aware of differences in order to make a right decision.

1. You don’t need to edit HTML code to include scripts

Depending on how your website is organized, this could be a major tasks, especially if it contains lot of static HTML pages. Adding script code to all of them will surely take time. If your website is based on some content management system with centralized design template, you’ll still need to be careful not to forget adding code to any additional custom pages outside this CMS.

2. Scripts take additional time to load

Regardless of what Google Analytics officials say, actual experiences prove otherwise. Scripts are scripts and they must take some time to load. If external file is located on a third-party server (as it’s the case with Google Analytics), the slowdown is even more noticeable, because visitor’s browser must resolve another domain.

As a solution they suggest putting inclusion code at the end of the page. Indeed, in that case it would appear that page is loaded more quickly, but the truth is that there’s a good chance that visitor will click another link before script is executed. As a result, you won’t see these hits in stats and they are lost forever.

3. If website exists, log files exist too

With JavaScript analytics, stats are available only for periods when code was included. If you forget to put code on some pages, the opportunity is forever lost. Similarly, if you decide to start collecting stats today, you’ll never be able to see stats from yesterday or before. Same applies to goals: metrics are available only after you decide to track them. With some log analyzers, you can freely add more goals anytime and still be able to analyze them based on log files from the past.

4. Server log files contain hits to all files, not just pages

By using solely JavaScript based analytics, you don’t have any information about hits to images, XML files, flash (SWF), programs (EXE), archives (ZIP, GZ), etc. Although you could consider these hits irrelevant, they are not for most webmasters. Even if you don’t usually maintain other types of files, you must have some images on your website, which could be linked from external websites without you knowing anything about it.

5. You can investigate and control bandwidth usage

Although you might not be aware of it, most hosting providers limit bandwidth usage and usually base their pricing on it. Bandwidth usage costs them and, naturally, it most probably costs you as well. You would be surprised how much domains (usually from third-world countries) poll your whole website on a regular basis, possibly wasting gigabytes of your bandwidth every day. If you could identify these domains, you could easily block their traffic.

6. Bots (spiders) are excluded from JavaScript based analytics

Similar as previous point, some (bogus) spiders misbehave and they are wasting your bandwidth, while you don’t have any benefit from them. In addition, server logs also contain information about visits from legitimate bots, such are Google or Yahoo. By using solely JavaScript based analytics you have no idea how often they come and which pages they visit.

7. Log files record all traffic, even if JavaScript is disabled

Certain percentage of users choose to turn off JavaScript, and some of them use browsers that don’t support it at all. These visits can’t be identified by JavaScript based analytics.

8. You can find out about hacker attacks

Hackers could attack your website with various methods, but neither of them would be recorded by JavaScript analytics. As every access to your web server is contained in log files, you are able to identify them and save yourself from damage (by blacklisting their domains or closing security holes on your website).

9. Log files contain error information

Without them, in general case, you don’t have any information about errors and status codes (such are Page not found, Internal server error, Forbidden, etc.). Without it, you are missing possible technical problems with your website that lower overall visitor’s perception of its quality. Moreover, any attempt to access forbidden areas of your website can be easily identified.

10. By using log file analyzer, you don’t give away your business data

And last but not least, your stats are not available to a third-party who can use them at their convenience. Google has bought all rights for, at that time, popular and quite expensive web statistics product (Urchin), repackaged it, and then allowed to anyone to use it for free. The question is: why? They surely get something in return, as Google Analytics license agreement allows them to use your information for their purposes, and even to share it with others if you choose to participate in sharing program.

What could they possibly use? Just to give few obvious ideas: tweaking AdWords minimum bids, deciding how to prioritize ads, improving their services (and profits) – all based on traffic data collected from you and others.

Related links

Busting the Google Analytics Mythbuster
Which web log analyzer should I use?
What price Google Analytics? (by Dave Collins)
Web Log Storming – an interactive web log analyzer

Web Log Storming survey – discount for participants

In order to improve our software and service, we would really appreciate if you could take few minutes of your time to anonymously answer 9 questions. In return, a 30% discount coupon is waiting for you on the last page! With 30% discount you can get Web Log Storming new license for $132 (US), or an upgrade for as low as $55 (US).

Note that coupon does not expire: you can get it now by taking a survey and use it whenever it’s convenient for you. On the other hand, survey will expire as soon as we collect enough data for analysis.

To properly understand and answer questions, you should have at least some experience with Web Log Storming. So if you didn’t already, please download and install 30 days evaluation version.

Download Web Log Storming

Take a survey and get a 30% discount

Busting the Google Analytics Mythbuster

In the recent article at Google Analytics Blog author tries to bust several myths circulating in the public. You can find few half-truths and (intentional?) deceptions there that I simply can’t ignore.

As I mentioned earlier, Google Analytics could be a nice addition to the main analytics solution (even we are using it occasionally), providing that you don’t mind the baggage that comes with “free” label (What price Google Analytics?, Google Analytics – is it worth its price?, Google Analytics is not free, or search Google πŸ™‚ for more). JavaScript based systems give some information that log files can’t, but they also suffer from several drawbacks that are limiting the value if used alone.

As each product has its own audience, I won’t question anyone’s decision to choose one type of solution or another, but some things simply must be said, regardless of how many people will read this compared to the original article. πŸ™‚

MYTH 1: “You get what you pay for.” Google Analytics is free, which means the system is down a lot.”

I do agree that GA system is not down very often (if ever). Why it would be? They have more than enough resources to keep it alive, and imagine how much data they would lose in just one minute of downtime. But no matter how powerful their servers are your website will inevitably be slower. I doubt that you’ll find this particularly alarming, but still…

MYTH 4: Google Analytics is not really accurate

Google Analytics uses JavaScript tags to collect data. This industry-standard method […] discrepancies greater than 10%, it’s due to an installation issue. Common problems include JavaScript errors, redirects, untagged pages and slow client-side load times.

[…]

All web analytics tools face the same technical limitations posed by JavaScript tags […]

Ouch. This one is a main motivation for me to write the article. I’ll just comment phrases in bold (in the order of the appearance).

  1. JavaScript tags are just one of methods used today. Even if we ignore custom in-house systems (based on whatever web developers use: PHP, ASP, Python, Ruby on Rails, …), pretending that still widely accepted server log file analysis don’t exist is at least an intentional delusion.
  2. Expected discrepancies of 10% or below among JavaScript based analyzers could be true, but compared to log file analysis, they show 2 to 5 times less traffic.
  3. It could be the installation issue only if visitors can be tracked with JavaScript. What about other traffic?
  4. Again, we can talk about errors and slow connection only when JavaScript tracking is possible.
  5. Saying that all web analytics tools face the same limitations is simply not true. JavaScript based web analytics tools do have these limitations, but not log file analyzers.

Pardon me if you don’t care about visitors that block JavaScript or click on a different link before tracking script is loaded, websites that directly link to images on your website, downloads of non-html files (PDF, ZIP, EXE, images, …), bandwidth usage, spiders, bots that pull down the whole website on a regular basis (wasting your bandwidth), direct access to scripts by hackers, etc, etc. Sure, with JavaScript analytics you can see trends and if you only care about marketing it could be good enough, but total number are not even close, and you can forget about other information that can be found in server log files.

MYTH 6: With Google Analytics you can’t control your data

Yes, you can control your data… at some degree. Google promises to resists the urge to analyze your data for own purposes (if you don’t forget to explicitly say so), but the fact is that they already have your data, right there. In this information era knowledge is a big asset. Sorry, but I don’t buy that they won’t ever “peek”, just a little. Probably under the excuse of “serving better search results” (or more likely, “serving better advertisements”). And I’m not talking about analytics only: they have search queries, e-mails, documents, appointments, instant messages, etc. They predicted Eurovision 2009 contest winner based on what people search and I should believe that they won’t silently use all the information they can for profits? Right…

Even if you do trust Google (and every its employee), you still can’t say that you fully control your data as it’s still on their servers. Anything can happen in the future. What if Google goes to bankruptcy? Okay, not likely, but possible. πŸ™‚ Therefore, you can’t fully control your data, but don’t get me wrong: I admit that there are few pros. For example, you don’t need to think about backup – the data is much safer on Google servers than on your computer. πŸ™‚

* * *

Disclaimer: the purpose of this article is not to persuade anyone to use server log analyzer instead of Google Analytics (I wrote another article for this πŸ™‚ ), but to point out few things that are too easily overlooked these days, intentionally or not.

Web Log Storming 2.0 final

Web Log Storming screenshotWe have just released final version of our interactive web log analyzer (web stats) software Web Log Storming 2.0.

Web Log Storming is an interactive, desktop-based web log analyzer for Windows. A whole new concept of website statistics makes it clearly different from any other web log analytics software. Browse through stats to drill down into details – down to an individual visitor’s session. Check the pattern of individual visitor behavior and how it fits into your goals.

Web Log Storming does far more than just generate common reports. It displays detailed web site statistics with interactive graphs and reports. Complete and detailed log analysis of activity from every visitor to your web site is only a mouse-click away.

Version 2.0 introduces number of new features and improvements, including:

  • Goals
  • Tabbed reports
  • Six new report types (including cities and regions)
  • New parameters and global filters
  • Better speed and stability
  • Other usability / user interface improvements

To see what’s else new in this version, please visit this page.

What’s New in v2.0
Product Website

Web Log Storming 2.0 Beta 2 available for download

Thank you all for your suggestions and bug reports. We have released Beta 2 (build 481) with bugs fixed and few usability improvements.

As first beta proves itself rather stable (except one serious bug with Countries report, which is fixed now), next release will probably be final. If you haven’t already, now it’s a good time to consider special “early bird” offer .

Some of changes in Beta 2 (build 481) include:

  • Crash in Countries report with some log files
  • Hits and Bandwidth trend report combined with Path parameter fixed
  • In addition to F5, you can now refresh report by pressing Enter key in Parameters panel
  • Multi-select in log file location editor
  • Sample log files are updated

For download and more information visit this page.